30–40% Returns: Photo Based Size Predictor Accuracy That Matters
Size predictors work, but “accurate” depends entirely on what’s being measured. The only test that actually proves reliability is a production A/B comparing kept orders and return rates against a control group.
TL;DR:Size prediction accuracy varies widely depending on the algorithm, with the best models achieving around 89.66% on support vector machine tests.
A significant portion of shoppers do not fit neatly into standard size categories, leading to failures in prediction models, especially for borderline or uncommon bodies.
Proper evaluation of size predictors requires detailed metrics, time-based data splits, statistical significance tests, and real-world production A/B testing rather than just headline accuracy.
High average accuracy figures can mask poor performance on tail cases, new brands, or low-history shoppers, which are critical to reducing return rates.
Measurement-based tools using photos and actual body data, like ClothMe’s profile system, outperform cohort-based models and better address cold-start and borderline sizing issues.
Table of Contents
How accurate are size predictors, according to published studies?
The headline numbers vary more than most shoppers expect. A study of 677 participants tested a support vector machine (SVM) against bust, waist, and hip measurements and reported 89.66% accuracy, while a PCA-SVM variant on the same data managed notably lower accuracy. That’s a substantial gap between two models fed the same measurements, which tells you the algorithm matters almost as much as the data.
The same study surfaced something size charts don’t like to admit: over one-third of participants didn’t cleanly align with any single size category. Their bodies fell between standard cuts, which is precisely the population where any predictor is most likely to fail.
Newer architectures push further. PreSizE, a Transformer-based framework built for e-commerce, outperforms prior baselines across multiple large retail datasets, with micro precision around 50.8% and clear gains once the model has roughly 15 prior purchases to learn from.
A few things separate a credible result from a marketing number:
Micro vs. macro averages — micro averages weight by frequency (common sizes dominate the score); macro averages treat every size class equally, exposing weak performance on rare sizes.
Train/validation/test splits — credible studies hold out a genuinely separate test set, often split by time, so the model isn’t graded on data it already memorized.
Statistical significance testing — paired t-tests, bootstrap resampling, and Bonferroni correction (for comparing multiple models at once) separate a real improvement from noise.
Top-k reporting — accuracy at k=1 versus k=3 tells you whether the model nails the exact size or just gets close.
None of this is decoration.
Why reported accuracy can overstate real-world reliability
A model can score well on paper and still misfire in a shopping cart. The reasons are structural, not just statistical.
Size labels are not physical units. A “medium” from one brand can differ from another brand’s “medium” by two inches at the waist, because garment grading rules aren’t standardized. A predictor trained on one brand’s historical returns can be exactly right for that brand and wrong everywhere else. That’s a cold-start problem: a new brand or a new item with no purchase history gives cohort-based models nothing to learn from.
Historical data carries its own bias. If a retailer’s past shoppers skewed toward certain body shapes, the model inherits that skew and underperforms for anyone outside it, which usually means the same borderline shoppers flagged in the 677-participant study above.
Where accuracy claims break down:
High average accuracy can mask poor performance in the tails, exactly where most returns originate.
Cohort methods scale well but struggle on new items and body types that don’t resemble their training data.
Vendor-reported hit rates aren’t comparable across vendors without a shared test set and methodology.
Fashion e-commerce returns still run 30% to 40% by some industry estimates, and structural issues, inconsistent size charts, body diversity, and shopper behavior, limit how much any single tool can move that number.
How to evaluate size predictors properly
Researchers and retailers judging a size predictor need a protocol, not a headline number. Here’s the sequence that produces a trustworthy answer:
Report both micro and macro metrics — precision, recall, F1, and AUC, broken out by size class, not just averaged across the whole catalog.
Use top-k accuracy where multiple sizes fit — top-1 alone punishes models unfairly in categories with forgiving cuts.
Hold out data by time, not randomly, so the test mimics predicting for future orders rather than reshuffling the past.
Run statistical tests — paired t-tests or bootstrap confidence intervals, with Bonferroni correction if comparing more than two models.
Segment results by borderline body types, new brands, and low-history shoppers, since that’s where models fail first.
Follow with a production A/B, measured over a full return-window cycle, tracking kept orders, return rate, and revenue per session against a control group.
Pro Tip: Ask any vendor for their macro F1 score, not just overall accuracy. A model with 90% micro accuracy can still be near useless for anyone who doesn’t fit the most common size, and macro scores expose that gap immediately.
Retailers should treat offline metrics as a screening step, not proof. The real evidence is an A/B outcome measured against kept orders and returns, because that’s the only number tied to actual revenue.
Practical advice for shoppers and product teams
If you’re shopping, the tool you pick matters less than the inputs it asks for. Height-and-weight calculators are the weakest category because they ignore shape entirely. Measurement or photo-based systems that map your actual body to a garment’s actual dimensions perform better on borderline cases, largely because they compare body to garment spec instead of relying on a cohort that may not resemble you.
Shopper checklist:
Favor tools that use your actual measurements or photos over ones that only ask for height and weight.
Cross-check the garment’s own measurements against your body before trusting a recommended size, especially with a new brand.
Save your profile once it’s accurate. Re-entering your measurements for every purchase reintroduces the same guesswork you’re trying to avoid.
For product and merchandising teams evaluating vendors, the checklist is different but the discipline is the same.
Team checklist:
Demand a head-to-head A/B on your own catalog. A vendor’s accuracy number from someone else’s data means little for your return rate.
Track kept orders and the change in return rate, not just “recommendation accuracy” on a dashboard.
Segment results by category and by borderline body types before signing a contract.
Pro Tip: Trust a vendor’s offline accuracy claim as a filter to shortlist candidates. Trust only production A/B evidence, measured on your traffic, before you make a purchasing decision.
The ClothME approach to reducing sizing guesswork
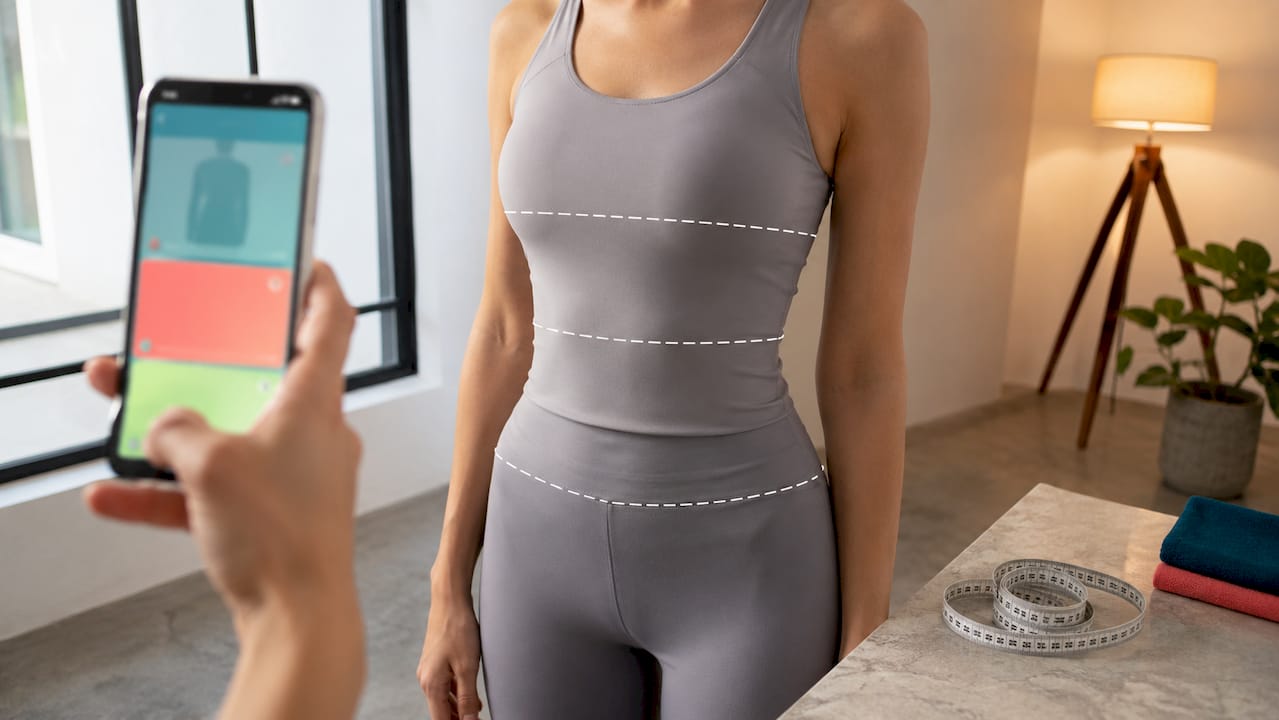
Clothme builds size profiles from two uploaded photos rather than a height-and-weight form or a brand-by-brand size chart. That distinction matters given everything above: measurement-based matching is exactly the approach that performs better on cold-starts and borderline cases, because it compares an actual body to actual garment dimensions instead of leaning on a cohort that may not represent the shopper at all.
The platform also lets a household save a profile for each family member, which solves a problem generic calculators never touch: a parent shopping for three different-sized kids across five different brands, each with its own idea of what “size 8” means.
How this fits the evidence:
Photo-based measurement addresses the cold-start problem that cohort models can’t solve for new brands.
Saved family profiles remove the repeated guesswork that drives return rates up.
Curated feeds filtered by fit, style, and fabric, mean shoppers see fewer items that were never going to fit in the first place.
What the evidence actually tells us about size prediction
The academic literature is more honest than most vendor pitches. Every study cited here, from the 89.66% SVM result down to PreSizE’s incremental gains, comes with a caveat about who the model fails: new brands, uncommon body shapes, shoppers without purchase history. That’s not a footnote. It’s the entire practical story.
The conventional advice, “look for the highest accuracy percentage,” gets this backward. What should carry more weight is the input method. A tool built on your actual measurements, tested against a real return-rate outcome, beats a tool with a higher headline number and a height-and-weight form.
If there’s one shift worth making, it’s this: stop treating offline accuracy as the finish line. It’s a screening step. The number that matters is what happens to returns after checkout, and that number only comes from testing against real orders, not benchmark datasets.
— admin
Get a Size Profile Built From Your Actual Measurements
Skip the brand-by-brand guessing game. Clothme builds your size profile from two photos in a few minutes, then filters product feeds so you’re only browsing items likely to fit your shape, style, and fabric preferences, not a whole catalog you have to size-check item by item.
That matters most for households juggling multiple sizes at once. Parents can save a profile for each kid and stop re-measuring every time a growth spurt hits or a new brand enters the cart. Because the matching runs on your actual body rather than a brand’s cohort data, it holds up better on the borderline cases and new-brand situations where generic calculators tend to fall apart.
Head to ClothME and build your first size profile before your next order, so you know your fit before you check out, not after the return label prints.
Sources
For the studies and industry analysis referenced above: the SVM/PCA-SVM sizing study, the PreSizE Transformer paper, the SFnet size and fit research, Kleep’s accuracy benchmark analysis, and BBC’s reporting on fashion’s sizing crisis. For product-side context, see ClothME’s guide on body measurement apps for clothing.